Data Science Projects, Reports, and Visualizations
Internship: Carpe Data
In this project, I provide an overview of my Data Science internship experience and describe the multi-label classification models I created to predict relevant insurance claim information from social media sites.
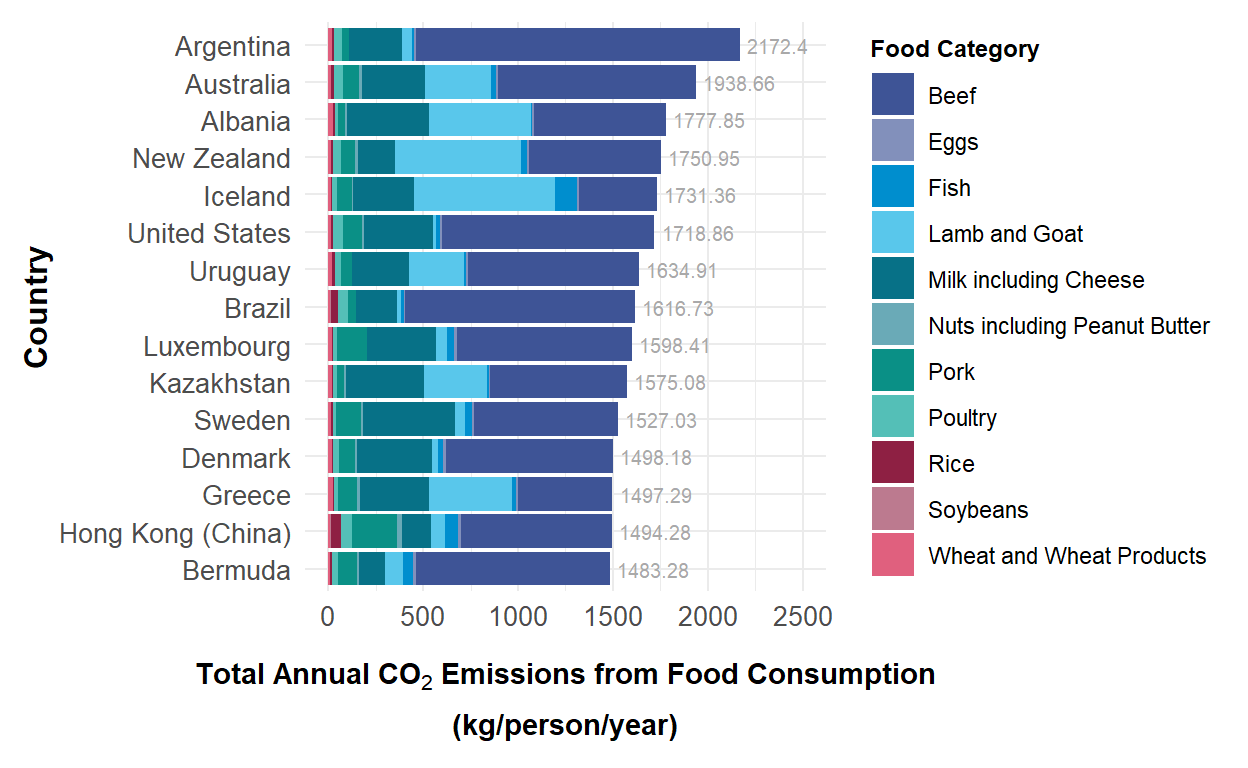
Data Visualization: Carbon Dioxide Emissions from Food Consumption
In this project, I created a data visualization of the top 15 countries with the highest total annual carbon dioxide emissions from food consumption using highly customized aesthetics in R.
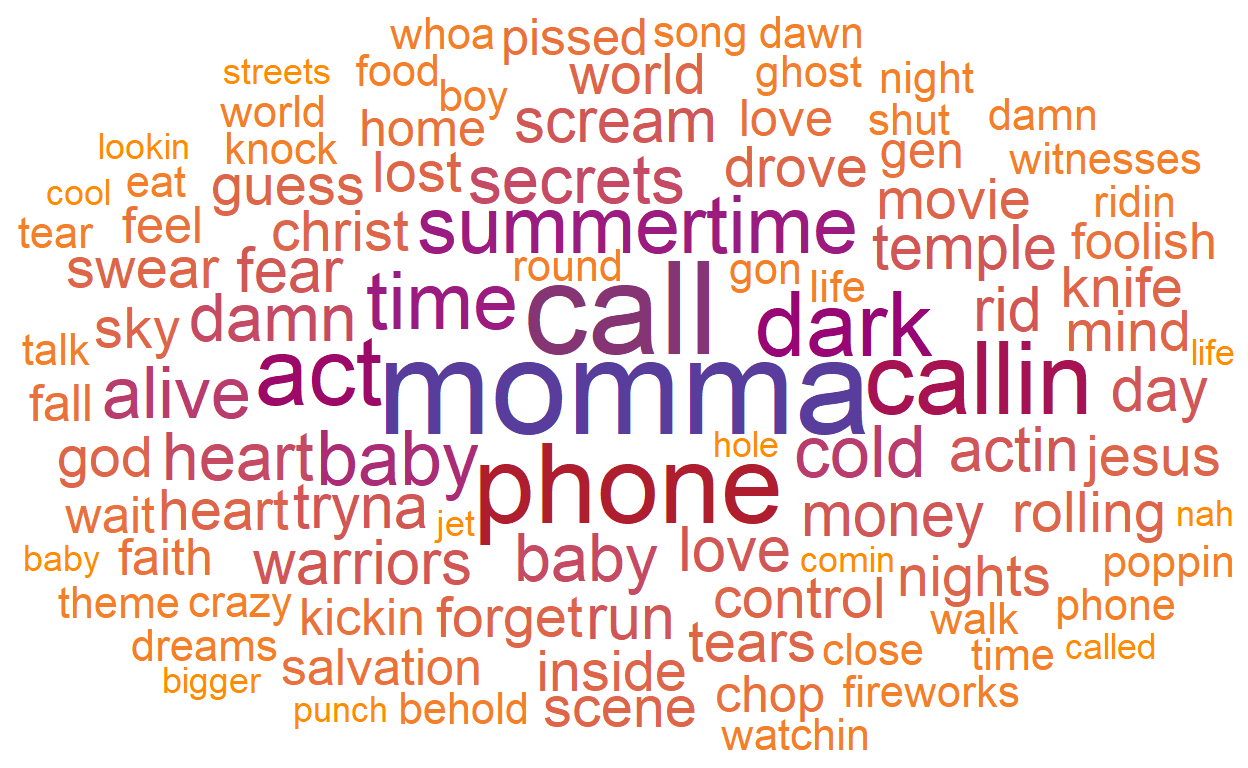
Text and Sentiment Analysis: Songs from Shang-Chi and the Legend of the Ten Rings: The Album
In this project, I explored songs from the *Shang-Chi* album by looking at word frequencies and conducted sentiment analysis using AFINN and NRC lexicons.
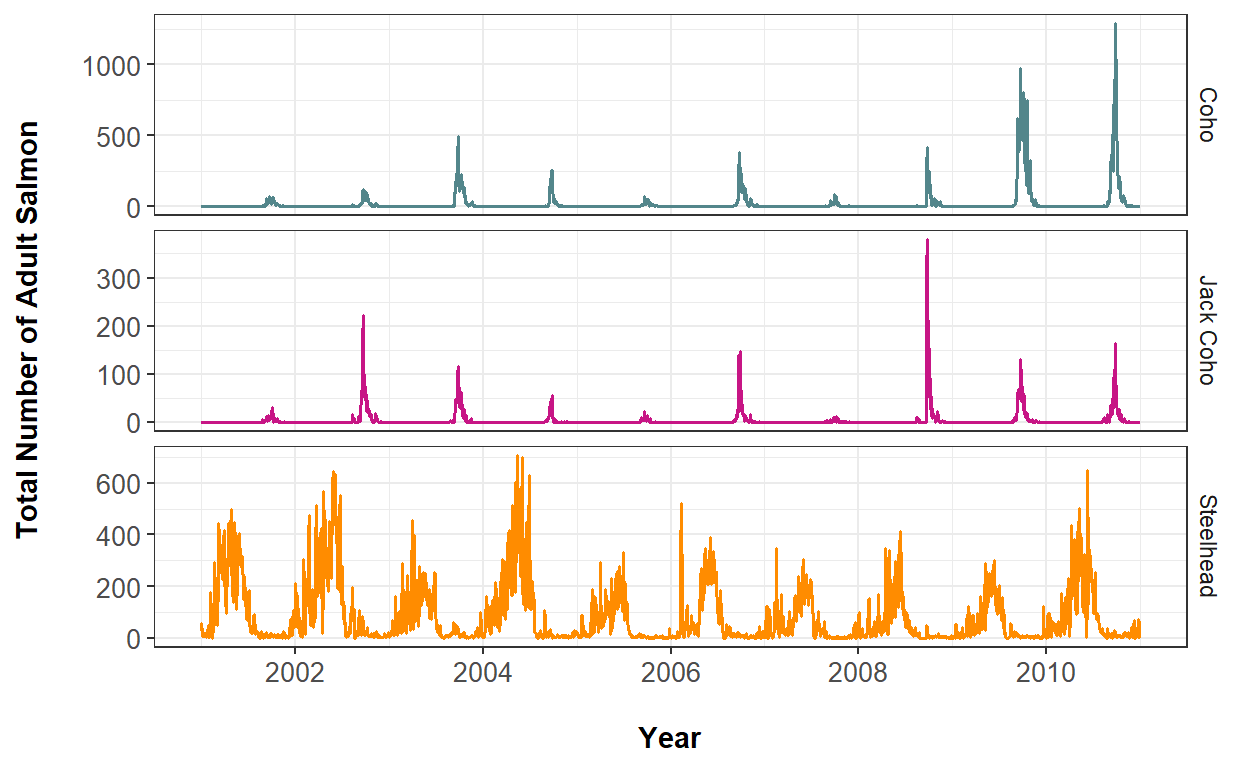
Time Series Analysis: Willamette Falls Fish Ladder Passage
In this project, I used time series analysis to explore and visualize various rates (daily, monthly, annual) of fish passage at the Willamette Falls Fish Ladder, Oregon for three different species of salmon.
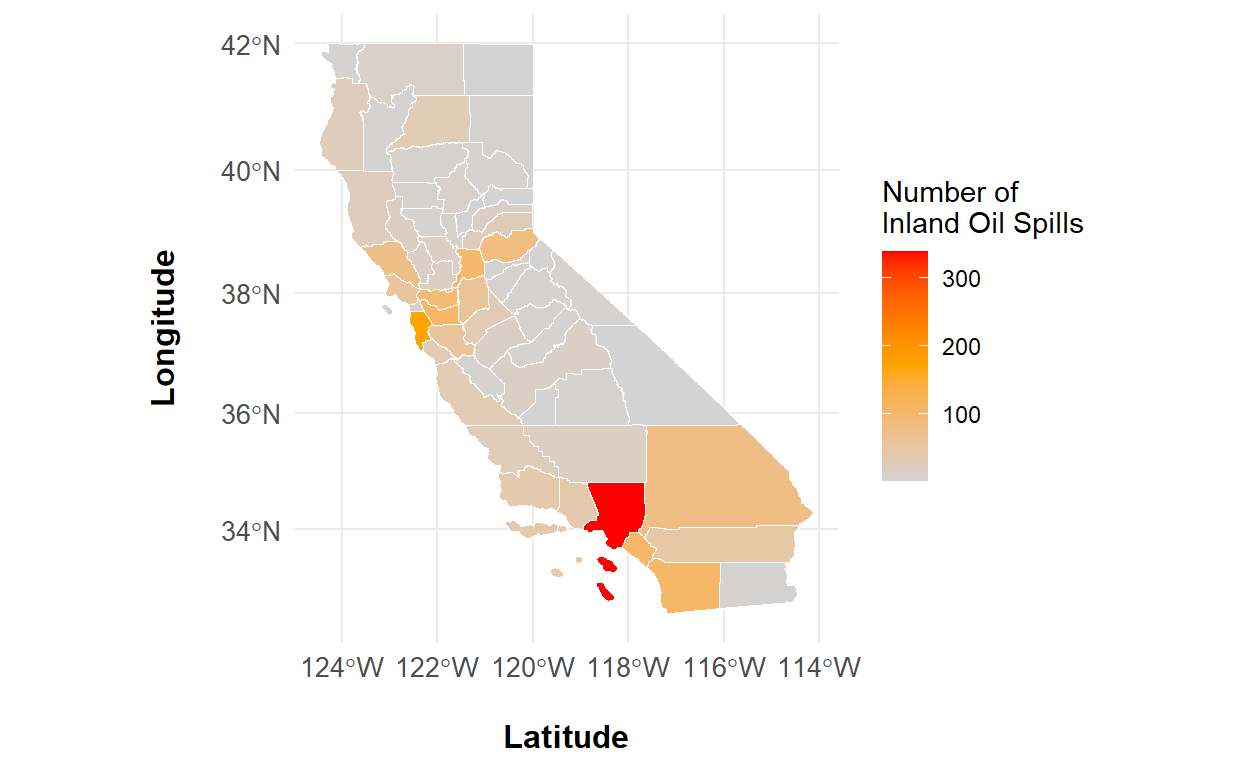
Spatial Analysis: California Oil Spills
In this project, I plotted spatial maps to visualize California oil spills by county and conducted point pattern analysis to investiate locations of spatial clusters of oil spills.
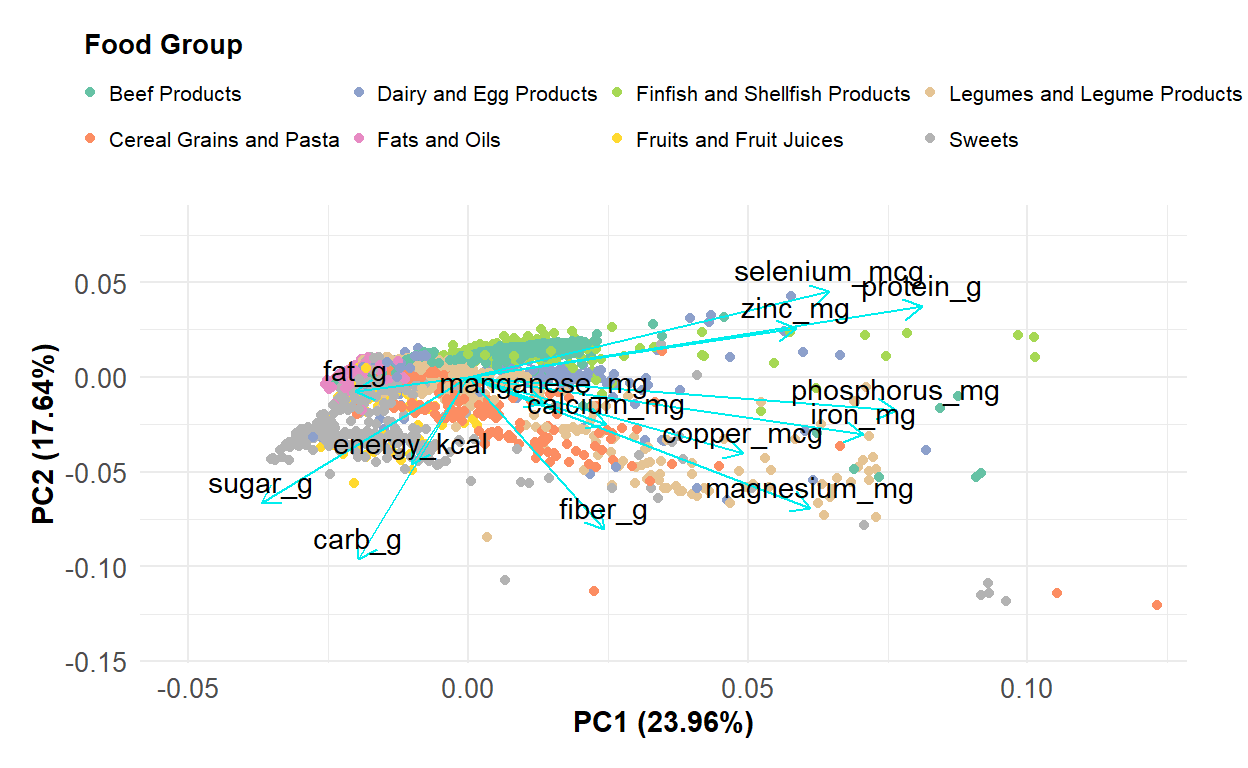
Principal Component Analysis: USDA Food Nutrient Information
In this project, I used principal component analysis to explore macronutrient and micronutrient information for various food groups listed by the United States Department of Agriculture.
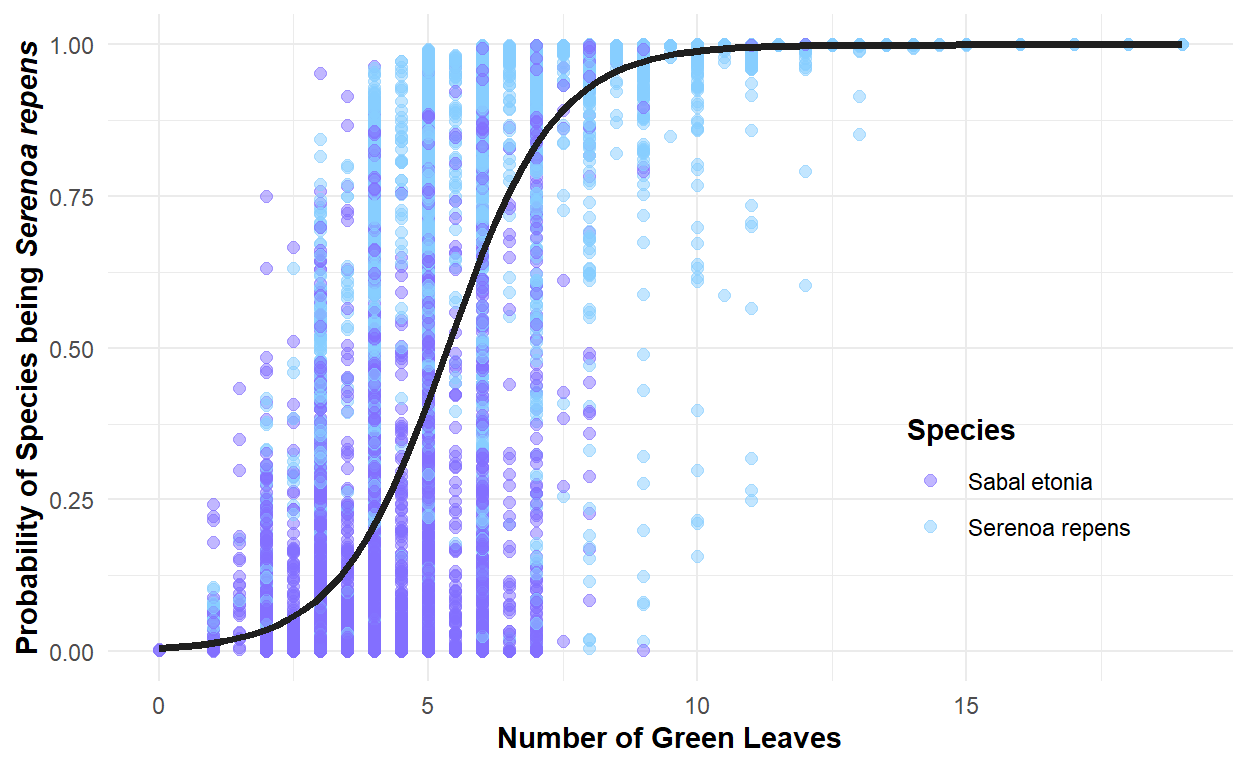
Logistic Regression: Classifying Florida Palmetto Species
In this project, I explored Florida palmetto data through exploratory visualizations and used binary logistic regression to classify palmetto species.
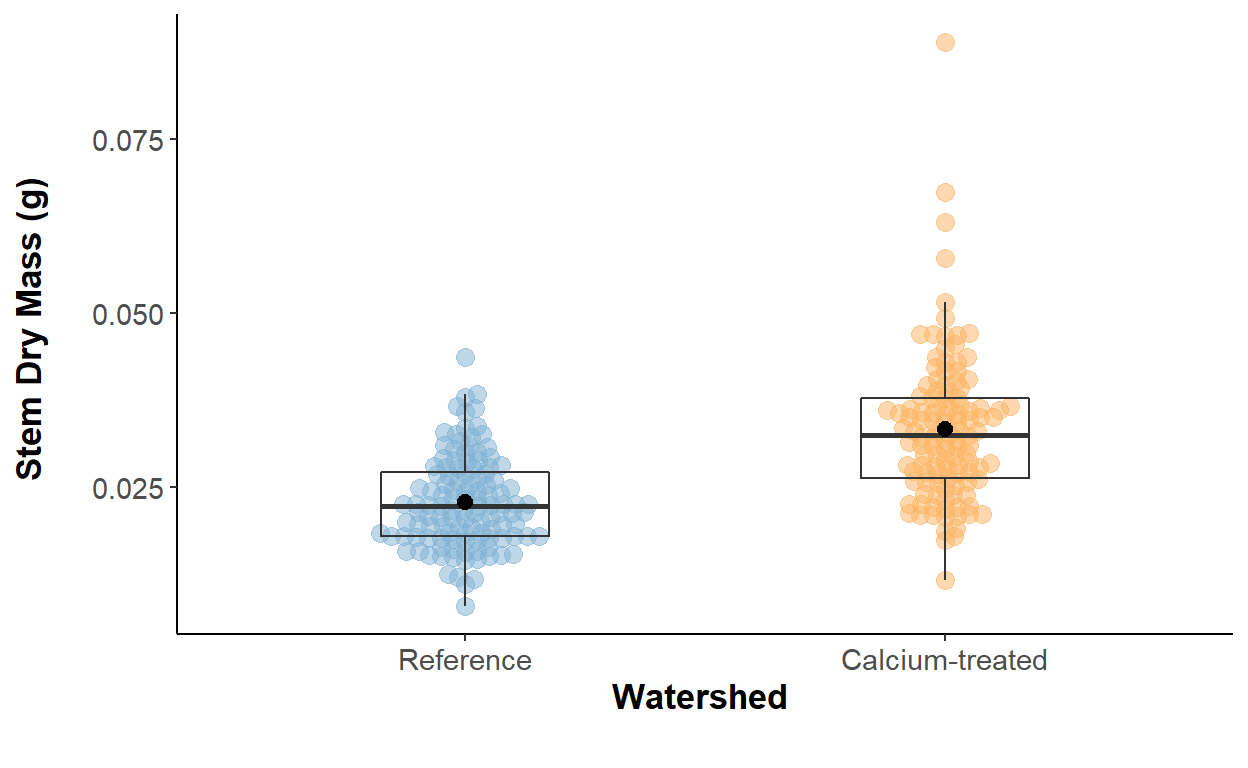
Hypothesis Testing: Different Watersheds on Sugar Maple Mass Growth
In this project, I investigated differences in sugar maple stem dry mass from treatment and control watersheds in 2003.
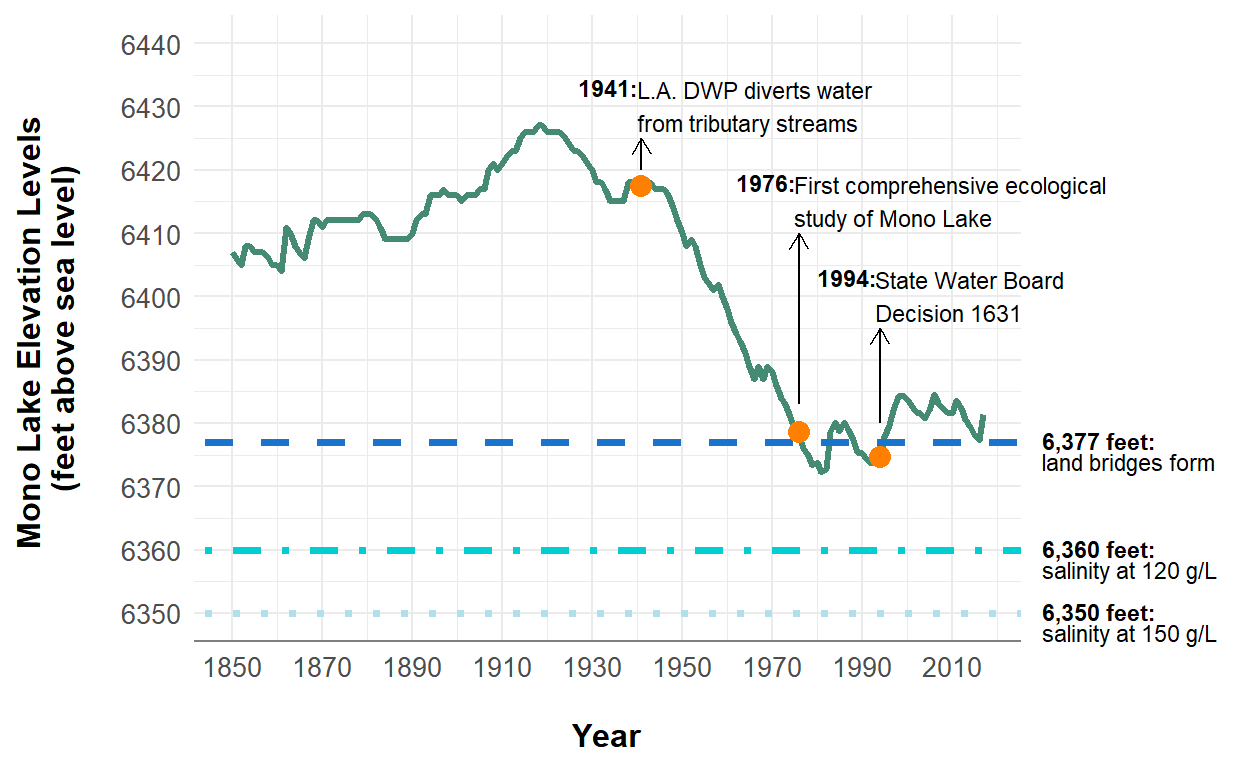
Data Visualization: Mono Lake Elevation Levels from 1850-2017
In this project, I created a data visualization of Mono Lake elevation levels and its major historical events using highly customized aesthetics in R.
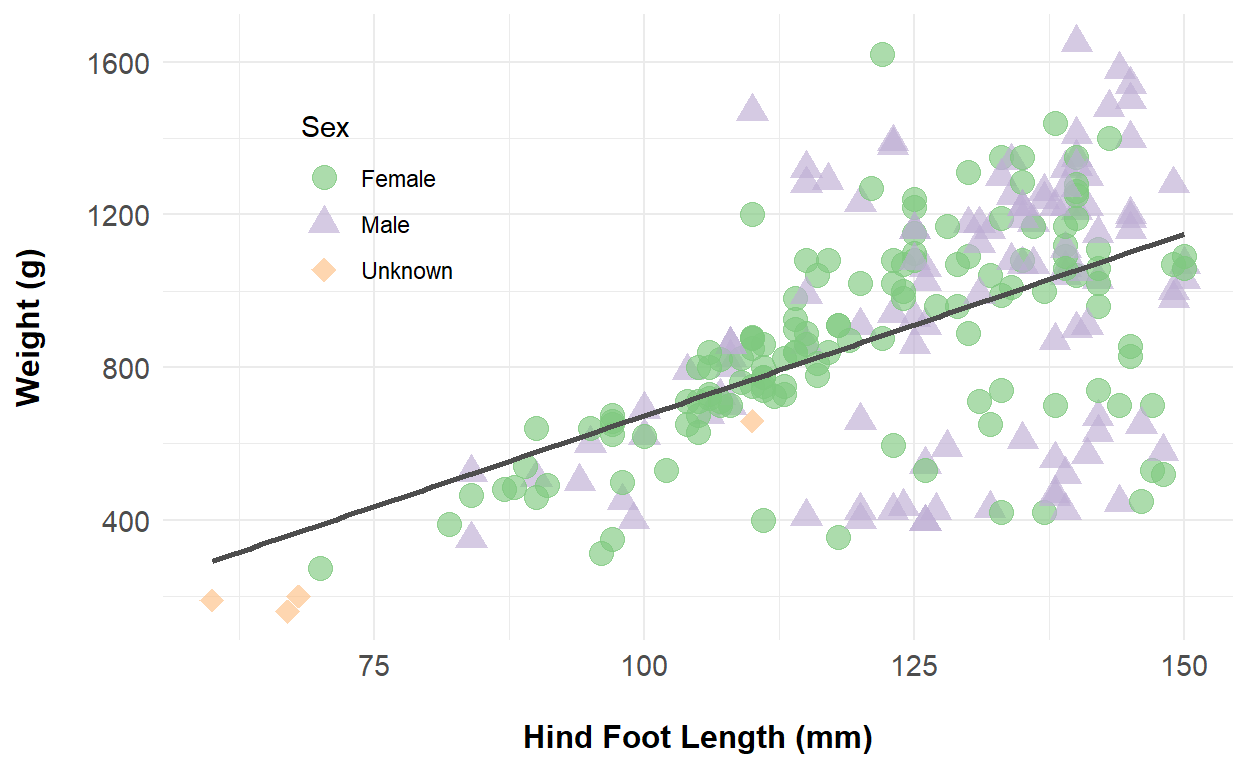
Linear Regression: Juvenile Snowshoe Hares at Bonanza Creek
In this project, I created an exploratory report for the relationship between body weight and hind foot length in juvenile female and male snowshoe hares using linear regression analysis.